Basic Tutorial
PerfFlowAspect is based on Aspect-Oriented Programming (AOP). PerfFlowAspect relies on annotated functions in the user’s source code and can invoke specific performance-analysis actions, a piece of tracing code, etc. on those points of execution. In AOP, these trigger points are called join points in the source code, and the functionality invoked is called advice. To learn more about AOP and associated terminology, please refer to our presentation slides here.
The python package perfflowaspect contains the PerfFlowAspect tool for the
Python language. The file src/python/perfflowaspect/aspect.py contains a key
annotating decorator. Users can use the
@perfflowaspect.aspect.critical_path() decorator to annotate their functions
that are likely to be on the critical path of the workflow’s end-to-end
performance. These annotated functions then serve as the join points that can be
weaved with PerfFlowAspect to be acted upon. The decorator accepts the following
pointcut values at the join points:
before: The advice is invoked only before the join point.after: The advice is invoked only after the join point.around: The advice is invoked both before and after the join point.
The asynchronous versions of these pointcut values are also supported in
PerfFlowAspect, which are: before_async, after_async, and
around_async.
Note: The default pointcut value is around.
The following shows a simple snippet that annotates two functions.
import perfflowaspect.aspect


@perfflowaspect.aspect.critical_path()
def bar(message):
    time.sleep(1)
    print(message)


@perfflowaspect.aspect.critical_path()
def foo():
    time.sleep(2)
    bar("hello")


def main():
    foo()
Once annotated, running this python code will produce a performance trace data
file named perfflow.<hostname>.<pid>. It uses Chrome Tracing Format in JSON
so that it can be loaded into Google Chrome Tracing to render the critical path
events on the global tracing timeline, using the Perfetto visualization tool.
Details on these can be found at the links below:
Chrome Tracing Tool: https://www.chromium.org/developers/how-tos/trace-event-profiling-tool/
Perfetto Visualizer: https://perfetto.dev/
To disable all PerfFlowAspect annotations, set the
PERFFLOW_OPTIONS="log-enable=" to False at runtime.
PERFFLOW_OPTIONS="log-enable=False" ./test/smoketest.py
PerfFlowAspect CLI Options
PerfFlowAspect options can be set with the PERFFLOW_OPTIONS environment
variable. Separate multiple variables with a colon as follows:
PERFFLOW_OPTIONS="<var1>=<val1>:<var2>=<val2>" <executable>
Variable |
Description |
Default Value |
Supported Values |
|---|---|---|---|
name |
Name of this workflow component |
generic |
|
log-filename-include |
Customize name of log file |
hostname,pid |
name,instance-path,hostname,pid |
log-dir |
Directory where log file is created |
./ |
|
log-enable |
Toggle annotations on/off |
True |
True, False |
cpu-mem-usage |
Collect CPU and memory usage metrics |
False |
True, False |
log-event |
Collect B and E events (verbose) or single X event (compact) |
Verbose |
Verbose, Compact |
log-format |
Dump JSON events in array or object format |
Array |
Array, Object |
caliper-enable |
Toggle Caliper data collection on/off (for Python only). |
False |
True, False |
Visualization of PerfFlowAspect Output Files
There are two types of logging allowed in PerfFlowAspect trace files which are
verbose and compact. Either can be enabled by setting
PERFFLOW_OPTIONS="log-event=" to compact or verbose, respectively.
The logging is verbose by default. Verbose logging uses B (begin) and E
(end) events in the trace file as shown below:
[
  {"name": "foo", "cat": "/PerfFlowAspect/src/c/test/smoketest.cpp", "pid": 3134, "tid": 3134, "ts": 1679127184455376.0, "ph": "B"},
  {"name": "bar", "cat": "/PerfFlowAspect/src/c/test/smoketest.cpp", "pid": 3134, "tid": 3134, "ts": 1679127184456525.0, "ph": "B"},
  {"name": "bas", "cat": "/PerfFlowAspect/src/c/test/smoketest.cpp", "pid": 3134, "tid": 3134, "ts": 1679127184457610.0, "ph": "B"},
  {"name": "bas", "cat": "/PerfFlowAspect/src/c/test/smoketest.cpp", "pid": 3134, "tid": 3134, "ts": 1679127184457636.0, "ph": "E"},
  {"name": "bar", "cat": "/PerfFlowAspect/src/c/test/smoketest.cpp", "pid": 3134, "tid": 3134, "ts": 1679127184457657.0, "ph": "E"},
  {"name": "foo", "cat": "/PerfFlowAspect/src/c/test/smoketest.cpp", "pid": 3134, "tid": 3134, "ts": 1679127184457676.0, "ph": "E"},
  ...
]
The above trace file is generated for three functions with around pointcut
annotations. The same trace file will be reduced to half the lines with
compact logging which uses a single X (complete) events, as can be seen
below:
[
  {"name": "bas", "cat": "/PerfFlowAspect/src/c/test/smoketest.cpp", "pid": 2688, "tid": 2688, "ts": 1679127137181517.0, "ph": "X", "dur": 600.0},
  {"name": "bar", "cat": "/PerfFlowAspect/src/c/test/smoketest.cpp", "pid": 2688, "tid": 2688, "ts": 1679127137179879.0, "ph": "X", "dur": 2885.0},
  {"name": "foo", "cat": "/PerfFlowAspect/src/c/test/smoketest.cpp", "pid": 2688, "tid": 2688, "ts": 1679127137177783.0, "ph": "X", "dur": 5532.0},
  ...
]
The visualization of both types of logging in trace files will be the same in Perfetto UI. An example visualization is shown below:
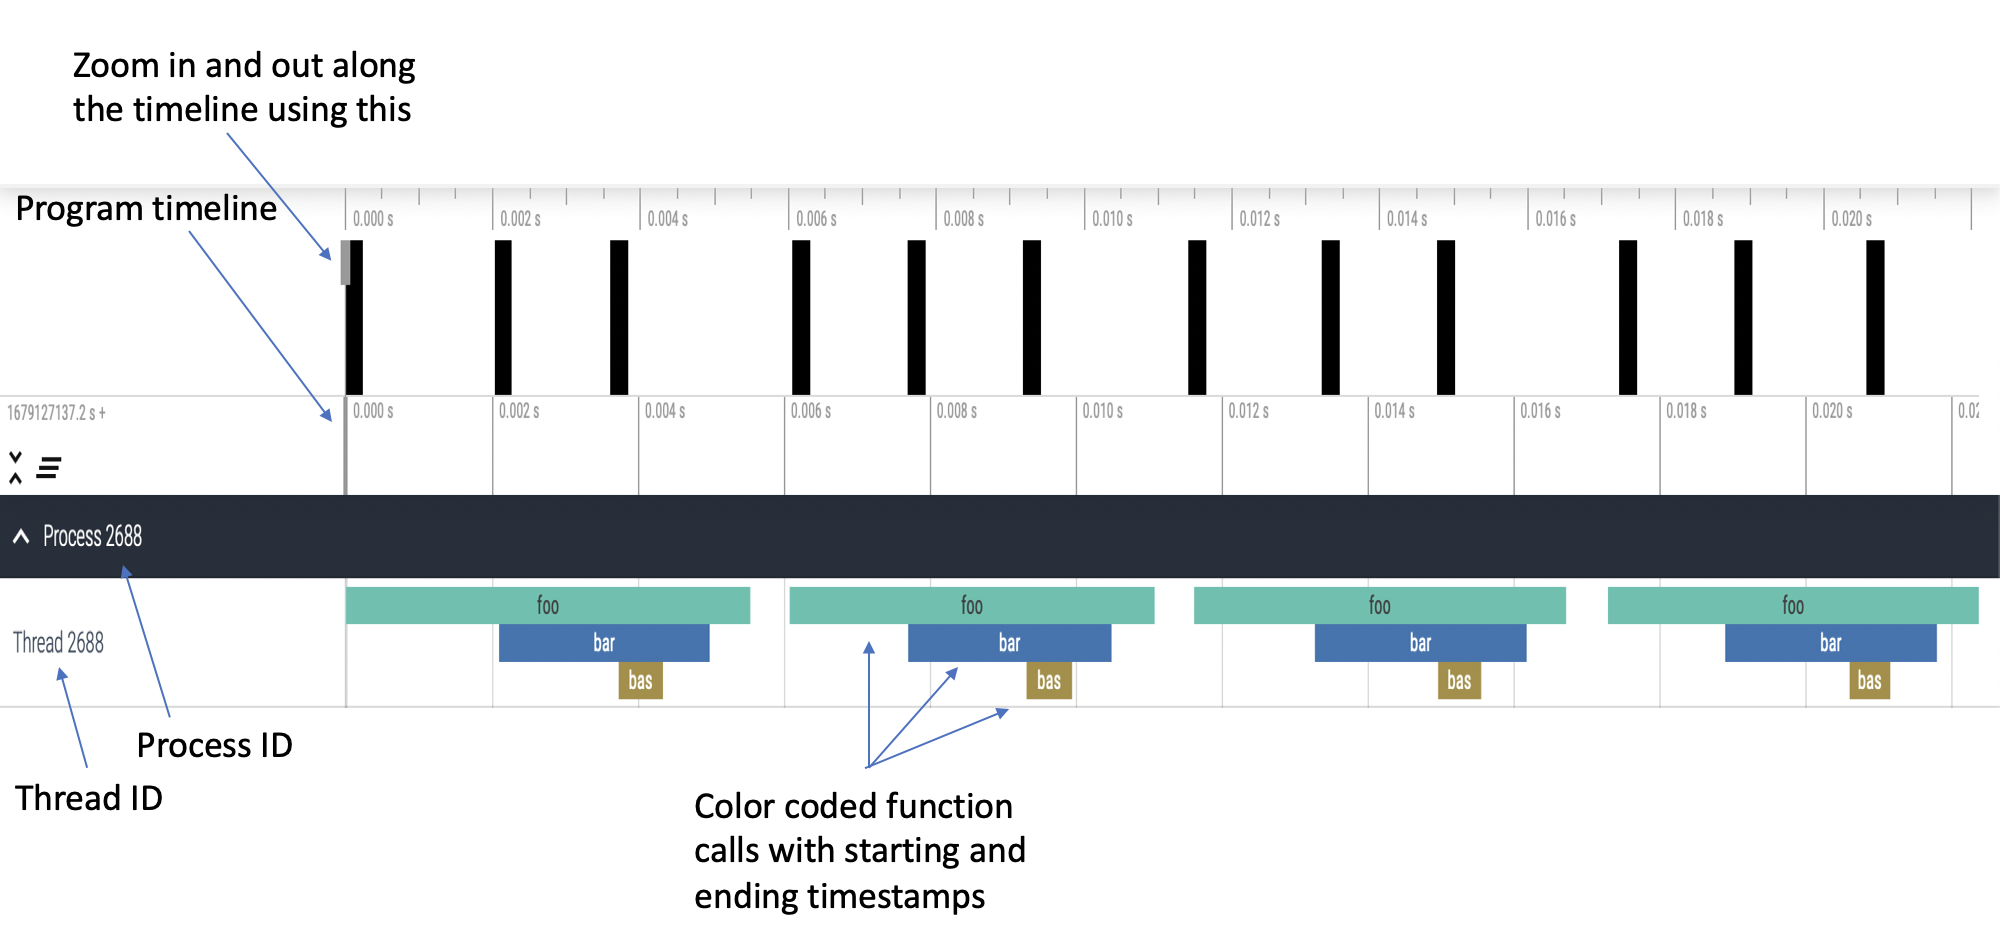
Fig. 1: Visualization of a single process, single thread program in Perfetto UI
The visualization in Fig. 1 is of the following python program:
#!/usr/bin/env python

import time
import perfflowaspect
import perfflowaspect.aspect


@perfflowaspect.aspect.critical_path(pointcut="around")
def bas():
   print("bas")


@perfflowaspect.aspect.critical_path(pointcut="around")
def bar():
   print("bar")
   time.sleep(0.001)
   bas()


@perfflowaspect.aspect.critical_path()
def foo(msg):
   print("foo")
   time.sleep(0.001)
   bar()
   if msg == "hello":
      return 1
   return 0


def main():
   print("Inside main")
   for i in range(4):
      foo("hello")
   return 0


if __name__ == "__main__":
   main()
PerfFlowAspect also allows the user to log CPU and memory usage of annotated
functions by setting PERFFLOW_OPTIONS="cpu-mem-usage=" to True at
runtime. The trace file, in that case, will have the following structure with
compact logging enabled:
[
  {"name": "bas", "cat": "/PerfFlowAspect/src/c/test/smoketest3.cpp", "pid": 44479, "tid": 44479, "ts": 1679184351167907.0, "ph": "C", "args": {"cpu_usage": 0.0, "memory_usage": 10944}},
  {"name": "bas", "cat": "/PerfFlowAspect/src/c/test/smoketest3.cpp", "pid": 44479, "tid": 44479, "ts": 1679184351168628.0, "ph": "C", "args": {"cpu_usage": 0.0, "memory_usage": 0}},
  {"name": "bas", "cat": "/PerfFlowAspect/src/c/test/smoketest3.cpp", "pid": 44479, "tid": 44479, "ts": 1679184351167907.0, "ph": "X", "dur": 721.0},
  {"name": "bar", "cat": "/PerfFlowAspect/src/c/test/smoketest3.cpp", "pid": 44479, "tid": 44479, "ts": 1679184351167127.0, "ph": "C", "args": {"cpu_usage": 11.980575694383594, "memory_usage": 10944}},
  {"name": "bar", "cat": "/PerfFlowAspect/src/c/test/smoketest3.cpp", "pid": 44479, "tid": 44479, "ts": 1679184351170287.0, "ph": "C", "args": {"cpu_usage": 0.0, "memory_usage": 0}},
  {"name": "bar", "cat": "/PerfFlowAspect/src/c/test/smoketest3.cpp", "pid": 44479, "tid": 44479, "ts": 1679184351167127.0, "ph": "X", "dur": 3160.0},
  {"name": "foo", "cat": "/PerfFlowAspect/src/c/test/smoketest3.cpp", "pid": 44479, "tid": 44479, "ts": 1679184351165193.0, "ph": "C", "args": {"cpu_usage": 98.625834450525915, "memory_usage": 14976}},
  {"name": "foo", "cat": "/PerfFlowAspect/src/c/test/smoketest3.cpp", "pid": 44479, "tid": 44479, "ts": 1679184351505085.0, "ph": "C", "args": {"cpu_usage": 0.0, "memory_usage": 0}},
  {"name": "foo", "cat": "/PerfFlowAspect/src/c/test/smoketest3.cpp", "pid": 44479, "tid": 44479, "ts": 1679184351165193.0, "ph": "X", "dur": 339892.0},
  ...
]
Following is the visualization for the python program above with CPU and memory usage logging enabled:
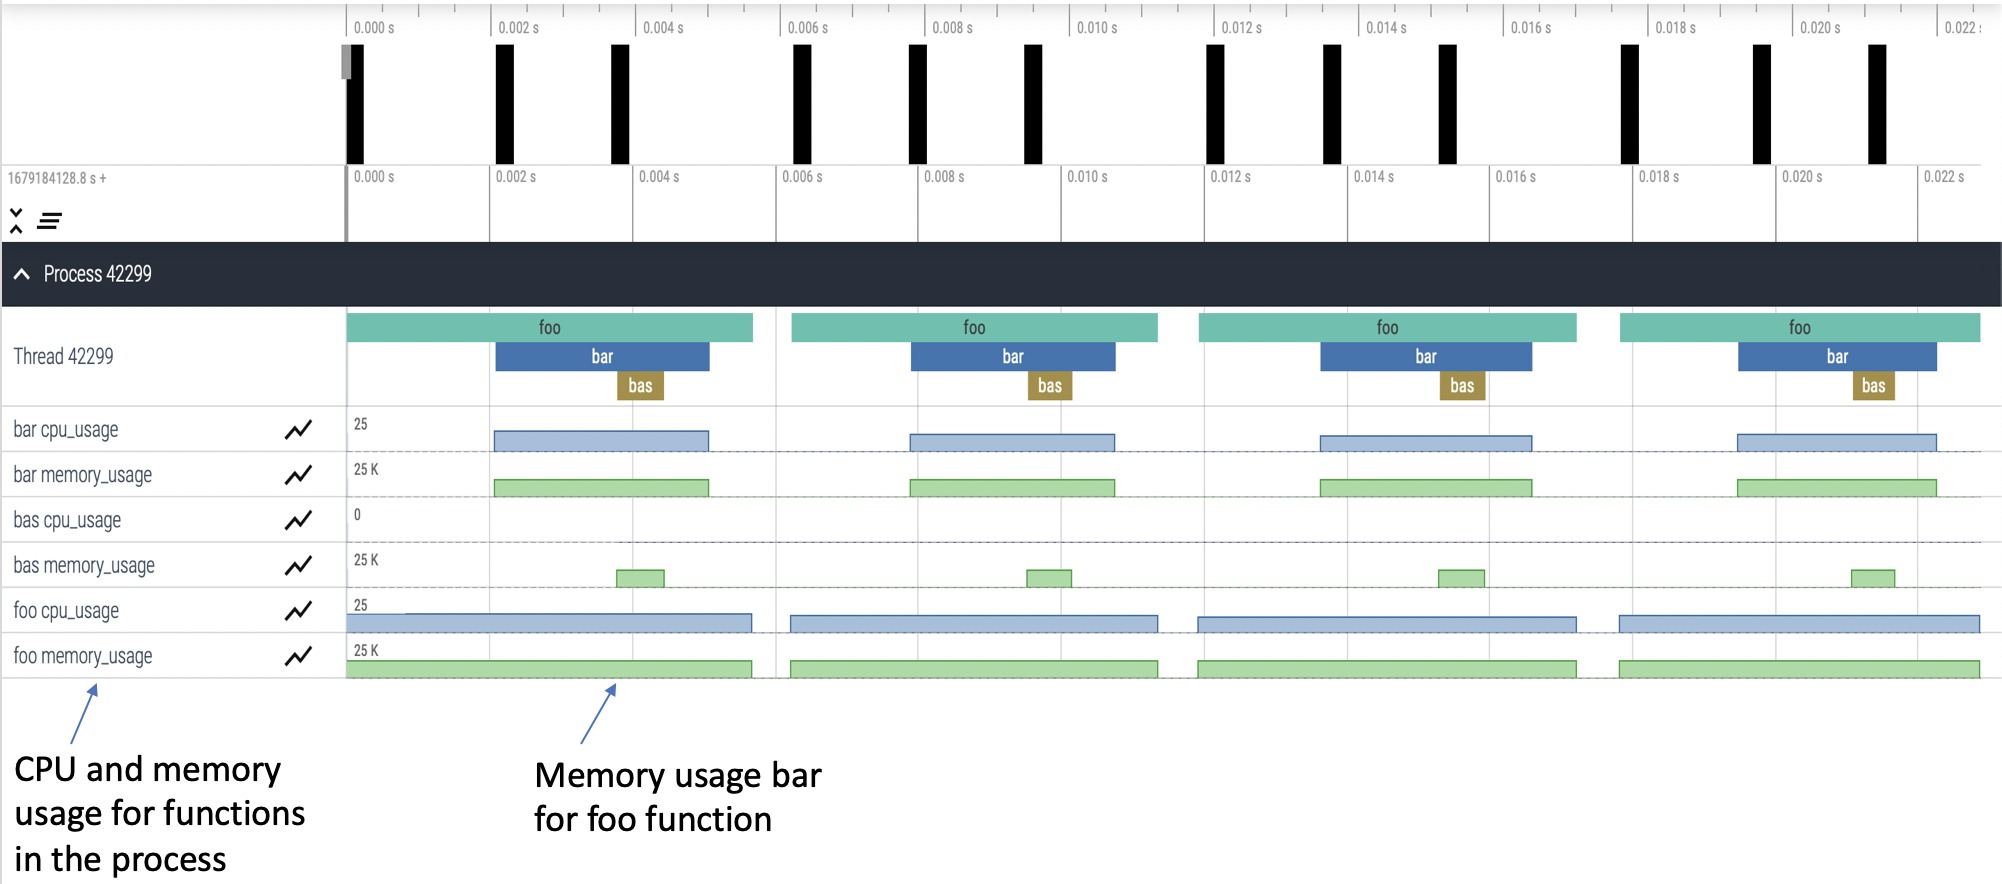
Fig. 2: Visualization of a single process, single thread program with CPU and memory usage